my pyplot setup
PyPlot huh? Honestly, the most flexible and useful plotting package I’ve ever used. Thankfully the port to Julia is seemless thanks to the PyPlot.jl package - since who wants to relearn how to use a plotting package?
However, its default look leaves much to be desired.
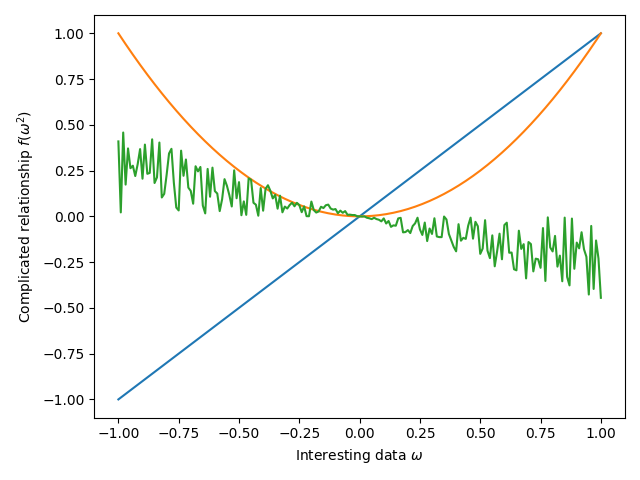
The colors aren’t too bad. They are obviously inspired by ColorBrewer to be a colorblind-friendly. However, the font looks ugly (especially the math symbols), the aspect ratio is unnecessarily squished and the font size is too small.
I have played around with the look of my plots for a long time and I’ve found a setup I like. Only a few modifications to the config file produce a plot that, I think, looks a lot nicer compared to the default setup.
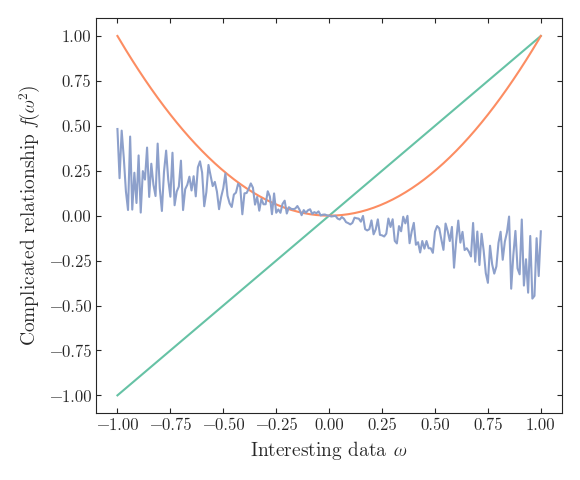
If you agree, I include here my matplotrc-file that produces the plot above. There are many settings one can play around with, all of which can be found here, which conveniently also explains how to install the config-file, which is platform-specific.
Note that the use of Computer Modern fonts can produce some headaches1.
# Makes boxes and such a bit less menacing by using white edges
patch.edgecolor: white
patch.force_edgecolor: True

# Use computer modern fonts when rendering so we can distinguish l and 1
font.family:  CMU Serif
# Make the labels readable without pushing your nose against the screen
font.size:    12.0

# Our eyes shouldn't hurt when reading graphs
text.color: .15

# This is some faffing that allows inkscape to properly manage text in my figures
# You might have to modify this based on your use case
mathtext.fontset: custom
mathtext.it:  CMU Serif:style=italic
mathtext.rm:  CMU Serif
mathtext.sf:  CMU Sans Serif
mathtext.tt:  CMU Typewriter Text

# Again, text should be readable and painless
axes.edgecolor:     .15
axes.labelcolor:    .15
axes.titlesize:     12
axes.labelsize:     14
axes.axisbelow:     True

# Put the plot in a nice cage so it's contained separate from the text
# If you dislike this, change it. I am not your mother.
axes.spines.left:   True
axes.spines.bottom: True
axes.spines.top:    True
axes.spines.right:  True

# This is the 8-color cycle of the palette Set2 from ColorBrewer
# As usual, pick your own, but this one is quite good for colorblindness
axes.prop_cycle: cycler('color', [(0.4, 0.7607843137254902, 0.6470588235294118), (0.9882352941176471, 0.5529411764705883, 0.3843137254901961), (0.5529411764705883, 0.6274509803921569, 0.796078431372549), (0.9058823529411765, 0.5411764705882353, 0.7647058823529411), (0.6509803921568628, 0.8470588235294118, 0.32941176470588235), (1.0, 0.8509803921568627, 0.1843137254901961), (0.8980392156862745, 0.7686274509803922, 0.5803921568627451), (0.7019607843137254, 0.7019607843137254, 0.7019607843137254)])

# Ticks everywhere!
xtick.top:           True
xtick.bottom:        True
xtick.color:         .15
xtick.labelsize:     12.0
xtick.direction:     in

ytick.left:          True
ytick.right:         True
ytick.color:         .15
ytick.labelsize:     12.0
ytick.direction:     in

# Legends should always roam free
legend.frameon:       False
legend.fontsize:      12.0

# I think I might need to check up on my eyesight
figure.titlesize:   16

# Square figures are king. What? It's not like you plot something other than linear relationships
figure.figsize:     5.8, 4.8

# Basic colormaps sucks - colorbrewer to the resque
image.cmap:            RdYlBu_r

# I always save in svg since it's easy to edit in inkscape
# By setting this to none the labels will actually text and not paths, which is essential if you wanna edit your plots
svg.fonttype: none
-
Here are my notes to install the fonts properly on a Linux system.
Install the
texlive-fullor something to that effect to get the fonts. You need to make sure that the system knows where these are, which is done by symlinking the correct font config to the correct folder.cd /etc/fonts/conf.d/ sudo ln -s /usr/share/fontconfig/conf.avail/09-texlive-fonts.conf . sudo fc-cache -fsvThe call to
fc-cachemight warn about looped directories. I have not had any issues with this, so I simply ignore it.To get the fonts to load correctly with
matplotlib, remove the cached font file withrm ~/.cache/matplotlib/fontlist-v330.json. ↩